 Mikrotik does routing beautifully but the same cannot be always said about its traffic monitoring facilities. While graphing does exist, its is as flexible as Trump supporter on immigration issues.
For me, one of the best ways to monitor router on the cheap is Cacti. Completely free and has built in SNMP support. Guess what else has built in SNMP support? Yep - Mikrotik.
To get Mikrotik's SNMP working, just enable it from terminal window, adjusting firewall if necessary:
/snmp set enabled=yes

/ip firewall filter
add chain=input protocol=udp dst-port=161 in-interface=!ether1 action=accept place-before=0 comment="Allow local SNMP"
While we are playing with Mikrotik, we can also print OIDs for queues:
/queue simple
print oid without-paging
 0    name=.1.3.6.1.4.1.14988.1.1.2.1.1.2.19
      bytes-in=.1.3.6.1.4.1.14988.1.1.2.1.1.8.19
      bytes-out=.1.3.6.1.4.1.14988.1.1.2.1.1.9.19
      packets-in=.1.3.6.1.4.1.14988.1.1.2.1.1.10.19
      packets-out=.1.3.6.1.4.1.14988.1.1.2.1.1.11.19
      queues-in=.1.3.6.1.4.1.14988.1.1.2.1.1.12.19
      queues-out=.1.3.6.1.4.1.14988.1.1.2.1.1.13.19
...
Just store this data somewhere are we are going to need bytes-in and bytes-out entries later.
To get Cacti running, I went with the latest Linux Mint distribution. Procedure is quite generic so you can select essentially any Linux. Just add a few packages:
sudo apt-get -y install lamp-server^
sudo apt-get -y install snmpd
sudo apt-get -y install cacti cacti-spine
During installation, some packages might have additional questions - especially password related - you might want to set. For the purpose of this exercise I just went with all defaults.
After all packages are installed, it is a good time to test if we get anything from Mikrotik:
snmpwalk -v 2c -c public 192.168.88.1And yes, this command is going to show a lot. :)
Now that we know SNMP is working we can go further with Cacti setup. For that we go to http://127.0.0.1/cacti and answer a few questions - essentially just setting the admin password and confirming tool locations.
The next thing on Cacti's Console page is selecting Devices and adding a new one. You need to enter Mikrotik's IP address here and change SNMP version to 2. Once you create entry, you should see system name and uptime.
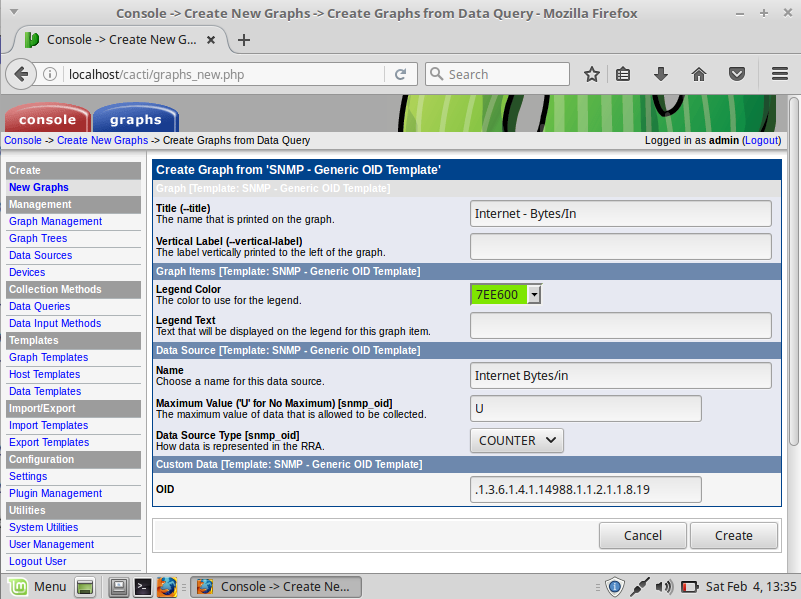
Now we can finally go to New Graph and create one based on SNMP - Generic OID Template. For the purpose of byte counting Maximum Value should be set to U and OID should be one belonging to Mikrotik's queue byte count. In my case value .1.3.6.1.4.1.14988.1.1.2.1.1.8.19 is the one used for input bytes of my Internet queue. A few minutes afterward you can check your Graphs/Preview tab and you should see your data nicely displayed.
Of course, with Cacti's seemingly infinite configurability, this is just a start. Feel free to snoop around and discover. :)
PS: To monitor router's health, check out resource OIDs:
/system resource print oid
             uptime: .1.3.6.1.2.1.1.3.0
    total-hdd-space: .1.3.6.1.2.1.25.2.3.1.5.1
     used-hdd-space: .1.3.6.1.2.1.25.2.3.1.6.1
       total-memory: .1.3.6.1.2.1.25.2.3.1.5.2
        used-memory: .1.3.6.1.2.1.25.2.3.1.6.2
           cpu-load: .1.3.6.1.2.1.25.3.3.1.2.1